R-Squared
R² (R-squared) is a measure of how well a model fits the data. It is a value between 0 and 1, where 1 is the best possible fit, defined by this equation:
Let's understand what this means with the help of an example.
The example#
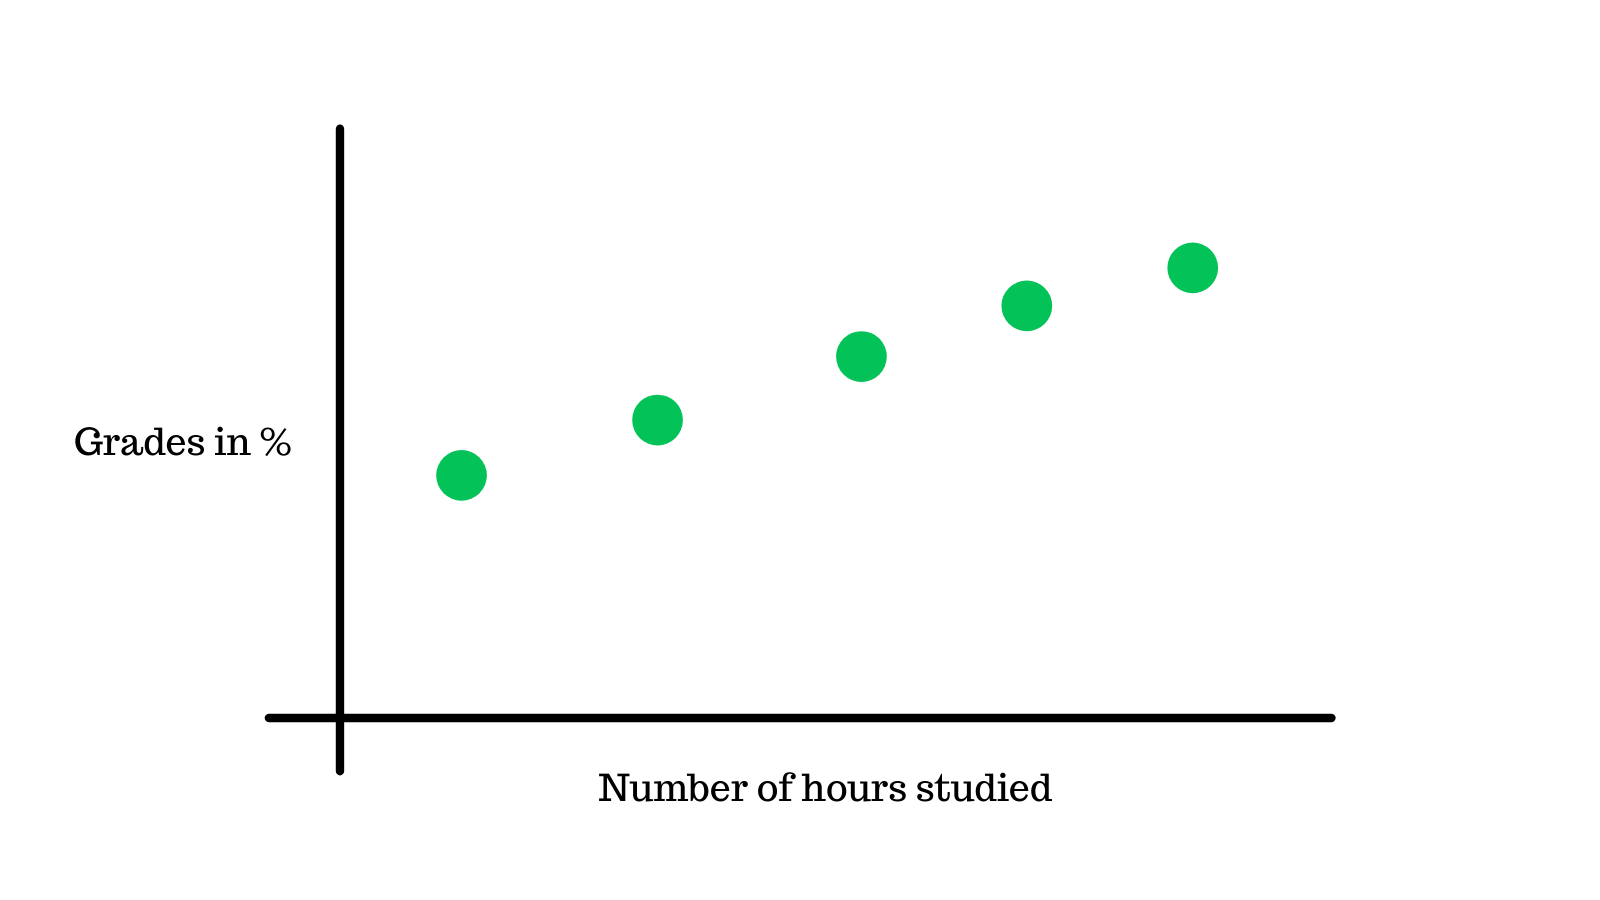
We have some data about the number of hours studied and the grades students got. For the sake of simplicity, we will assume that the grades have a linear relation to the hours studied.
Here we take 5 data points 30%, 40%, 50%, 60% and 70% directly proportional to the number of hours studied.
Variation on the mean#
The mean of these data points is 50%, we will plot this on the graph.
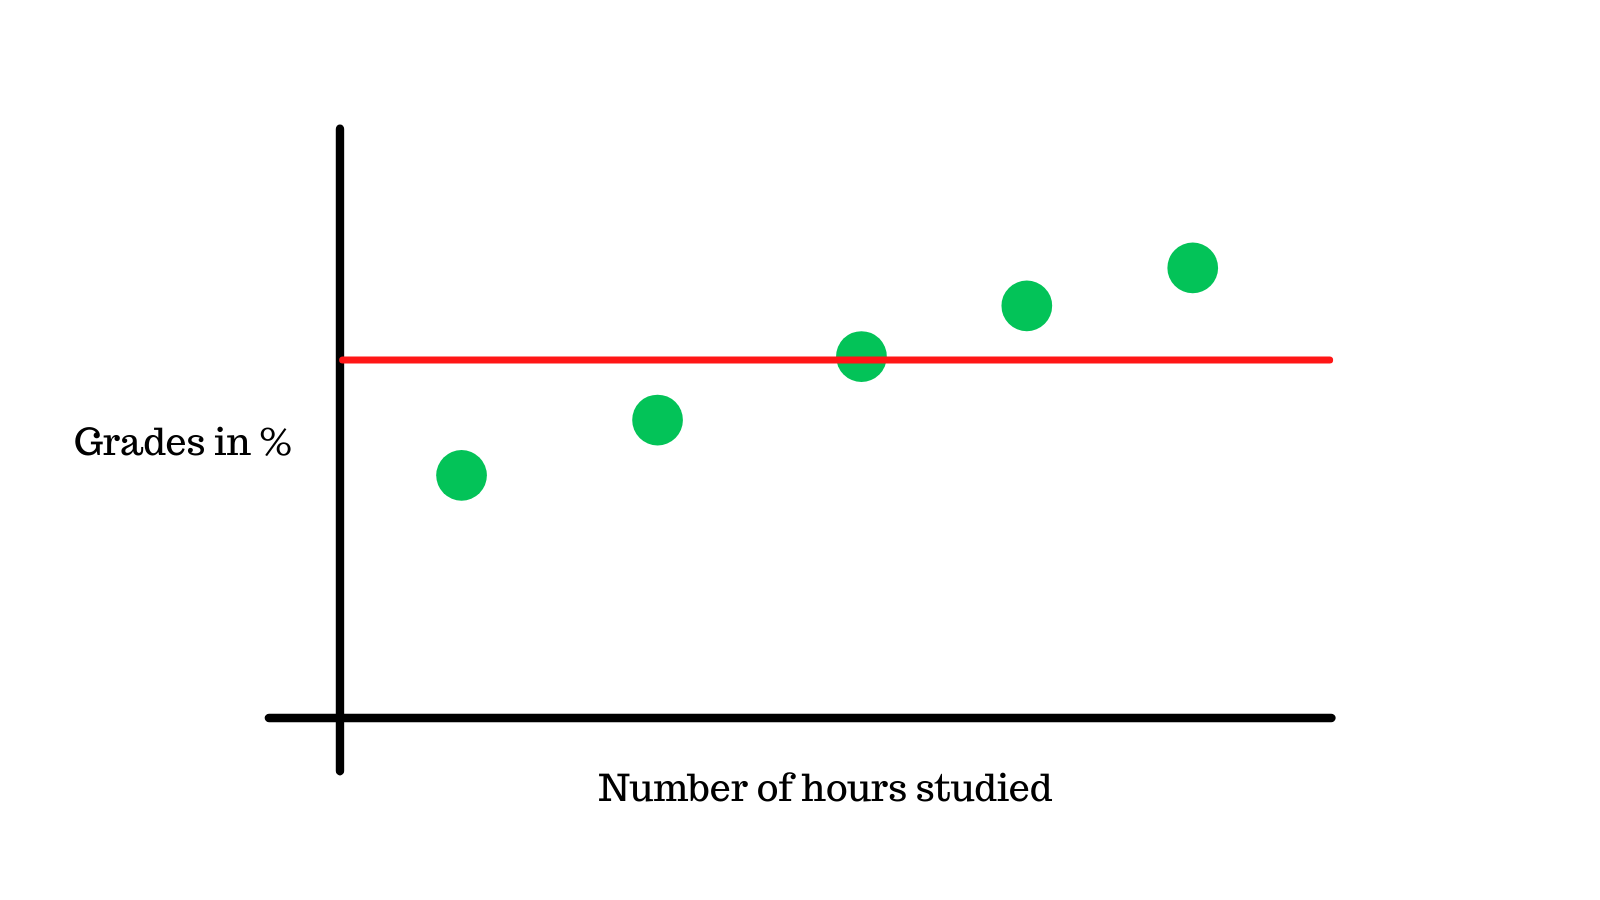
We will now calculate the variance of the data points, what this means is we take the sum of the squares of the differences between the data points and the mean.
Which is 50 (the mean) - 30 (the first data point) = 20, which we then square = 400.
We will repeat this for the other data points and add them up, the end result is 1000, this is the mean variance.
The reason why we square the values before adding them up is because some variances will be negative and some positive, which will cancel each other out. Let's say we have a variance of -10 and a variance of 10, the sum of those will be 0, which is not correct.
Squaring them ensures all variances are positive, that we can add up and get the correct variance.
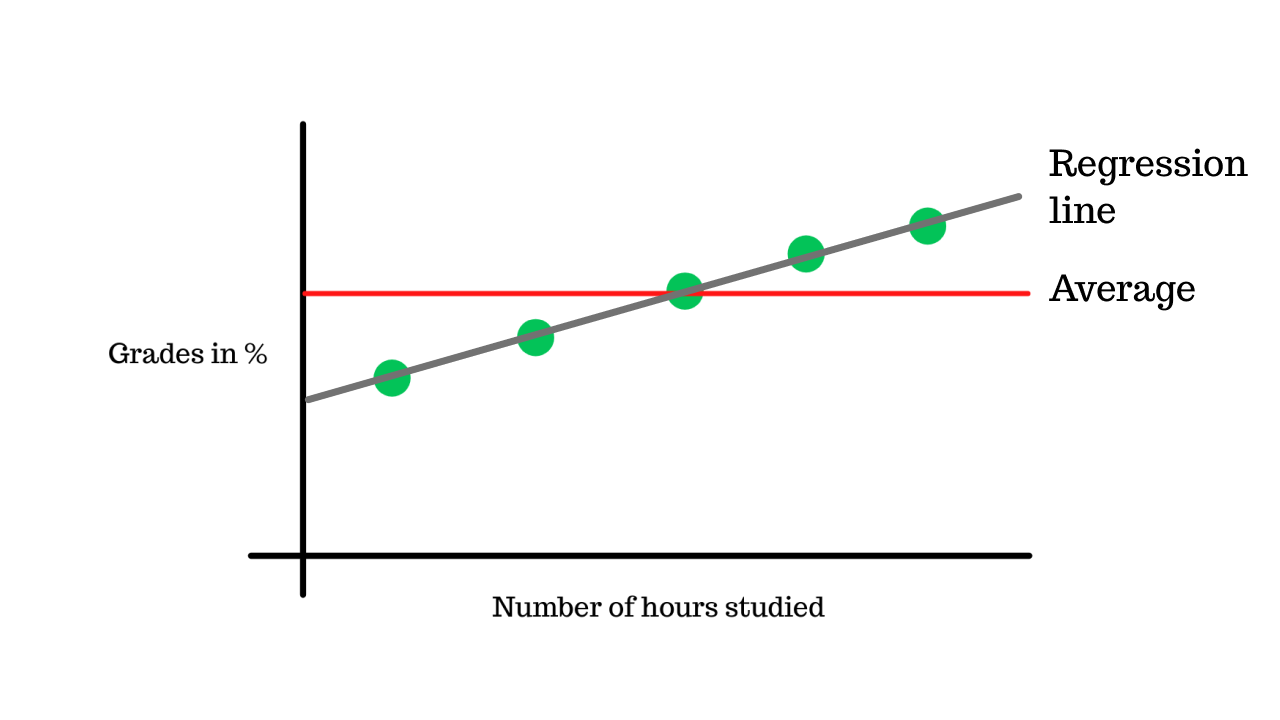
Variation on the regression#
The next step is to calculate the variance of the linear regression line. Since the data has a completely linear relation to the hours studied, the variance of the line is 0.
For example, 30% (the actual data point) - 30% (the data point predicted by linear regression model) = 0, which we then square = 0
We do this for all 5 data points and add them up, the end result is 0, which is the variance of the linear regression line.
Adding it all up#
We can now calcluate the R² value, by plugging in the mean variance and the variance of the linear regression line into the formula.
The R² value is 1, which means that the model fits the data perfectly, 100% of the variance is explained by the model. On the other hand if we had a model that predicted all the grades incorrectly, the R² value would be 0, no variance is explained by the model.
The question that we're answering here is "Does the model(regression line) fit the data better than mean and if yes, how much better is it?"
R² is also called the coefficient of determination, it is also used to analyze how differences in one variable are correlated with differences in another variable.
How strong the linear relationship is between the variables is explained by the correlation coefficient, R. This ranges from -1 to 0 and 1, where -1 means there is no linear relationship, 0 means there may or may not be a co-relation and 1 means there is a perfect linear relationship.
Coefficient of determination is the square of this value, R². It is easier to calculate than R, and also more intuitive to interpret.
In essence, the R² tells us the percentage of variables that are directly on the regression line.